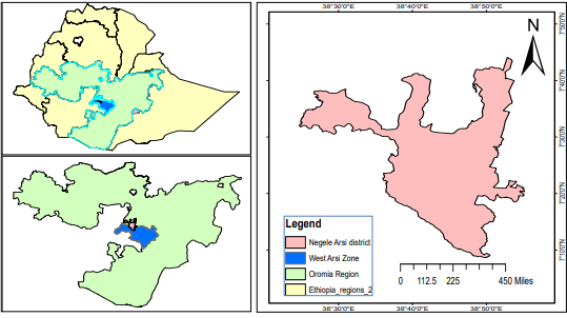
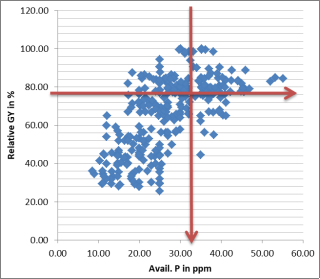
A phosphorus calibration study based on soil testing for maize was carried out in the Negele Arsi district, located in the Western Arsi Zone of Oromia, during the main cropping seasons spanning 2014 to 2016. The primary objectives were to establish the critical phosphorus level (Pc) and determine the phosphorus requirement factor (Pf) for maize, as well as to formulate soil test-based, site-specific phosphorus fertilizer recommendations. The experiment utilized a randomized complete block design (RCBD) with a factorial setup involving five nitrogen application rates (0, 23, 46, 69, and 92 kg ha-1) combined with three doses of phosphorus (0, 46, and 92 kg ha-1) to identify the optimum nitrogen rate for maize cultivation. During the subsequent two years of the study, a fixed nitrogen rate of 69 kg/ha (identified as optimum) was applied across all plots with varying phosphorus levels of 0, 10, 20, 30, and 40 kg ha-1 to pinpoint the phosphorus critical value and requirement factor. Soil samples were collected from the composite surface layer at each site before planting and again 21 days post-planting. Results revealed that the highest maize grain yield, averaging 7108 kg/ha, was achieved with an application of 69 kg N/ha alongside 46 kg P2O5/ha. The combination of 69 kg N/ha with 69 kg P2O5/ha yielded the maximum net return of 209,806 Birr per hectare. The study concluded that the phosphorus critical level for maize production in these soils is 31 ppm, with a phosphorus requirement factor of 3.06. These values merit validation through further trials before recommending for broader application.
| Published in | American Journal of Life Sciences (Volume 13, Issue 5) |
| DOI | 10.11648/j.ajls.20251305.11 |
| Page(s) | 129-135 |
| Creative Commons |
This is an Open Access article, distributed under the terms of the Creative Commons Attribution 4.0 International License (http://creativecommons.org/licenses/by/4.0/), which permits unrestricted use, distribution and reproduction in any medium or format, provided the original work is properly cited. |
| Copyright |
Copyright © The Author(s), 2025. Published by Science Publishing Group |
Phosphorus Calibration, Soil Testing, Maize, Nitrogen Optimization, Soil Sampling
Soil parameters | Mean | StD | Mini | Max | Classification | |
|---|---|---|---|---|---|---|
Level | References | |||||
Soil pH | 7.22 | 0.39 | 6.70 | 7.85 | Normal | Nachtergael (2023) |
avail p (ppm) | 17.96 | 5.56 | 9.4 | 27.55 | Medium | Nachtergael (2023) |
Soil O. C (%) | 1.87 | 0.33 | 1.37 | 2.71 | Low | FAO,2019 |
CEC me/100g | 9.23 | 2.11 | 5.13 | 14.57 | Low | Ayalew et al (2015 |
Total N(%) | 0.17 | 0.03 | 0.14 | 0.25 | low | Ayalew et al (2015 |
Texture | Sandy loam | |||||
Soil type | Mollic Andosol | |||||
Treatments | N in kg/ha | P2O5 in kg/ha | Mean Grain Yield in Kg/ha | Total Variable cost /ha | Gross Income/ha | Net benefit/ha |
|---|---|---|---|---|---|---|
1 | 0 | 0 | 1279.35 | 0 | 38380.5 | 38380.5 |
2 | 23 | 0 | 2685.11 | 2000 | 80553.3 | 78553.3 |
3 | 46 | 0 | 3083.54 | 4000 | 92506.2 | 88506.2 |
4 | 69 | 0 | 4585.55 | 6000 | 137566.5 | 131566.5 |
5 | 92 | 0 | 4590.65 | 8000 | 137719.5 | 129719.5 |
6 | 0 | 46 | 2469.21 | 3800 | 74076.3 | 70276.3 |
7 | 23 | 46 | 6886.34 | 5800 | 206590.2 | 200790.2 |
8 | 46 | 46 | 5701.57 | 7800 | 171047.1 | 163247.1 |
9 | 69 | 46 | 7320.21 | 9800 | 219606.3 | 209806.3 |
10 | 92 | 46 | 6777.33 | 11800 | 203319.9 | 191519.9 |
11 | 0 | 92 | 4075.24 | 7600 | 122257.2 | 114657.2 |
12 | 23 | 92 | 6089.54 | 9600 | 182686.2 | 173086.2 |
13 | 46 | 92 | 6307.68 | 11600 | 189230.4 | 177630.4 |
14 | 69 | 92 | 7081.45 | 13600 | 212443.5 | 198843.5 |
15 | 92 | 92 | 7287.35 | 15600 | 218620.5 | 203020.5 |
N kg/ha | P2O5 kg/ha | ||
|---|---|---|---|
0 | 46 | 92 | |
0 | 1279.35c | 2469.21c | 4075.24b |
23 | 2685.11c | 6886.34a | 6089.54ab |
46 | 3083.54c | 5701.57ab | 6307.68a |
69 | 4585.55b | 7320.21a | 7081.49a |
92 | 4590.65b | 6777.33a | 7287.35a |
CV (%) | 19.25 | ||
LSD 0.05 | 1507.50 | ||
No. | Treatment combination | Mean Grain yield in Kg/ha | Available P in PPMAfter 21 days | |
|---|---|---|---|---|
P2O5 in kg/ha | N in kg/ha | |||
1 | 0 | 69 | 3277d | 18.02d |
2 | 23 | 69 | 5386c | 22.36c |
3 | 46 | 69 | 6293b | 25.23b |
4 | 69 | 69 | 7108a | 36.00a |
5 | 92 | 69 | 6858a | 33.93a |
CV (%) | 17.44 | 21.8 | ||
LSD(0.05) | 352 | 2.12 | ||
No | Applied P (kg /ha) | Avail. P ppm (Olsen) | Change in avail. P (ppm) | Pf |
|---|---|---|---|---|
1 | 0 | 17.25 | 0.00 | - |
2 | 10 | 20.36 | 3.11 | 3.22 |
3 | 20 | 23.23 | 5.98 | 3.34 |
4 | 30 | 27.34 | 10.09 | 2.97 |
5 | 40 | 32.12 | 14.87 | 2.69 |
Average | 3.06 | |||
ANOVA | Analysis of Variance |
CEC | Cation Exchange Capacity |
CV | Coefficient of Variation |
FAO | Food and Agricultural Organization |
LSD | Least Significant Different |
Pc | Phosphorous Critical Level |
Pf | Phosphorous Requirement Factor |
Ppm | Perti Per Million |
RCBD | Randomized Complete Block Design |
SOC | Soil Organic Carbon |
TN | Total Nitrogen |
| [1] | Abebaw, W. A. (2019). Review on impacts of land degradation on agricultural production in Ethiopia. J. Resour. Dev. Manag, 57. |
| [2] | Abolfazli, F., Forghani, A., & Norouzi, M. (2012). Effects of phosphorus and organic fertilizers on phosphorus fractions in submerged soil. Journal of soil science and plant nutrition, 12(2), 349-362. |
| [3] | Admassu, L. (2017). Soil Test Based Phosphorous Fertilizer Recommendation for Tef [Eragrostis Tef (Zucc.) Trotter] Production on Nitisols of Central Ethiopian Highlands. |
| [4] | Agegnehu, G., Nelson, P. N., Bird, M. I., & Van Beek, C. (2015). Phosphorus Response and fertilizer recommendations for wheat grown on Nitisols in the central Ethiopian highlands. Communications in Soil Science and Plant Analysis, 46(19), 2411-2424. |
| [5] | Alemu, D., Yirga, C., Bekele, A., & Tesfaye, A. (2014). Situation and outlook of maize in Ethiopia. Ethiopian Institute of Agricultural Research. Addis Ababa. |
| [6] | Ayalew, A., Beyene, S., & Walley, F. (2015). Characterization and classification of soils of selected areas in Southern Ethiopia. Journal of Environment and Earth Science, 5(11), 116-137. |
| [7] | Bindraban, P. S., Dimkpa, C. O., & Pandey, R. (2020). Exploring phosphorus fertilizers and fertilization strategies for improved human and environmental health. Biology and Fertility of Soils, 56(3), 299-317. |
| [8] | Gebreslassie, H. B., & Demoz, H. A. (2016). A review of the Effect of Phosphorus Fertilizer on crop production in Ethiopia. Journal of Biology, Agriculture and Healthcare, 6(7), 117-120. |
| [9] | Haileselassie, B., Habte, D., Haileselassie, M., & Gebremeskel, G. (2014). Effects of mineral nitrogen and phosphorus fertilizers on yield and nutrient utilization of bread wheat (Tritcum aestivum) on the sandy soils of Hawzen District, Northern Ethiopia. Agriculture, Forestry and Fisheries, 3(3), 189-198. |
| [10] | Nachtergaele, F., van Velthuizen, H., Verelst, L., Wiberg, D., Henry, M., Chiozza, F.,... & Tramberend, S. (2023). Harmonized world soil database version 2.0. FAO.2023. |
| [11] | Ranum, P., Peña‐Rosas, J. P., & Garcia‐Casal, M. N. (2014). Global maize production, utilization, and consumption. Annals of the new York academy of sciences, 1312(1), 105-112. |
| [12] | Tadesse, T., Tadesse, Z., Assega, H., & Abaychew, D. (2019). Determination of Nitrogen and Phosphorous Fertilizer Rates on Lowland Rice Production. Results of Crop Improvement and Management Research 2018. |
| [13] | Tamene, L. D., Amede, T., Kihara, J. M., Tibebe, D., & Schulz, S. (2017). A review of soil fertility management and crop response to fertilizer application in Ethiopia: towards development of site-and context-specific fertilizer recommendation. CIAT publication. |
| [14] | Wakene Negassa, W. N., Heluf Gebrekidan, H. G., Abdena Deressa, A. D., & Geremew Eticha, G. E. (2005). Effect of integrated use of FYM, N and P fertilisers on maize yield in Western Oromia of Ethiopia. |
| [15] | Yebo, B. (2015). Integrated soil fertility management for better crop production in Ethiopia. International Journal of soil science, 10(1), 1-16. |
| [16] | Yimam, E., Nebiyu, A., Mohammed, A., & Getachew, M. (2015). Effect of nitrogen and phosphorus fertilizers on growth, yield and yield components of black cumin (Nigella sativa L.) at Konta District, South West Ethiopia. Journal of agronomy, 14(3), 112. |
| [17] | Zelleke, G., Agegnehu, G., Abera, D., & Rashid, S. (2019). Fertilizer and soil fertility potential in Ethiopia. Gates Open Res, 3(482), 482. |
APA Style
Hunde, K. K., Lindi, M. W. (2025). Soil Test Crop Response Based Phosphorus Calibration Study for Maize in Negele Arsi District of Western Arsi Zone Oromia. American Journal of Life Sciences, 13(5), 129-135. https://doi.org/10.11648/j.ajls.20251305.11
ACS Style
Hunde, K. K.; Lindi, M. W. Soil Test Crop Response Based Phosphorus Calibration Study for Maize in Negele Arsi District of Western Arsi Zone Oromia. Am. J. Life Sci. 2025, 13(5), 129-135. doi: 10.11648/j.ajls.20251305.11
@article{10.11648/j.ajls.20251305.11,
  author = {Kasahun Kitila Hunde and Mekonnen Workineh Lindi},
  title = {Soil Test Crop Response Based Phosphorus Calibration Study for Maize in Negele Arsi District of Western Arsi Zone Oromia
},
  journal = {American Journal of Life Sciences},
  volume = {13},
  number = {5},
  pages = {129-135},
  doi = {10.11648/j.ajls.20251305.11},
  url = {https://doi.org/10.11648/j.ajls.20251305.11},
  eprint = {https://article.sciencepublishinggroup.com/pdf/10.11648.j.ajls.20251305.11},
  abstract = {A phosphorus calibration study based on soil testing for maize was carried out in the Negele Arsi district, located in the Western Arsi Zone of Oromia, during the main cropping seasons spanning 2014 to 2016. The primary objectives were to establish the critical phosphorus level (Pc) and determine the phosphorus requirement factor (Pf) for maize, as well as to formulate soil test-based, site-specific phosphorus fertilizer recommendations. The experiment utilized a randomized complete block design (RCBD) with a factorial setup involving five nitrogen application rates (0, 23, 46, 69, and 92 kg ha-1) combined with three doses of phosphorus (0, 46, and 92 kg ha-1) to identify the optimum nitrogen rate for maize cultivation. During the subsequent two years of the study, a fixed nitrogen rate of 69 kg/ha (identified as optimum) was applied across all plots with varying phosphorus levels of 0, 10, 20, 30, and 40 kg ha-1 to pinpoint the phosphorus critical value and requirement factor. Soil samples were collected from the composite surface layer at each site before planting and again 21 days post-planting. Results revealed that the highest maize grain yield, averaging 7108 kg/ha, was achieved with an application of 69 kg N/ha alongside 46 kg P2O5/ha. The combination of 69 kg N/ha with 69 kg P2O5/ha yielded the maximum net return of 209,806 Birr per hectare. The study concluded that the phosphorus critical level for maize production in these soils is 31 ppm, with a phosphorus requirement factor of 3.06. These values merit validation through further trials before recommending for broader application.
},
 year = {2025}
}
TY  - JOUR
T1  - Soil Test Crop Response Based Phosphorus Calibration Study for Maize in Negele Arsi District of Western Arsi Zone Oromia

AU  - Kasahun Kitila Hunde
AU  - Mekonnen Workineh Lindi
Y1  - 2025/10/18
PY  - 2025
N1  - https://doi.org/10.11648/j.ajls.20251305.11
DO  - 10.11648/j.ajls.20251305.11
T2  - American Journal of Life Sciences
JF  - American Journal of Life Sciences
JO  - American Journal of Life Sciences
SP  - 129
EP  - 135
PB  - Science Publishing Group
SN  - 2328-5737
UR  - https://doi.org/10.11648/j.ajls.20251305.11
AB  - A phosphorus calibration study based on soil testing for maize was carried out in the Negele Arsi district, located in the Western Arsi Zone of Oromia, during the main cropping seasons spanning 2014 to 2016. The primary objectives were to establish the critical phosphorus level (Pc) and determine the phosphorus requirement factor (Pf) for maize, as well as to formulate soil test-based, site-specific phosphorus fertilizer recommendations. The experiment utilized a randomized complete block design (RCBD) with a factorial setup involving five nitrogen application rates (0, 23, 46, 69, and 92 kg ha-1) combined with three doses of phosphorus (0, 46, and 92 kg ha-1) to identify the optimum nitrogen rate for maize cultivation. During the subsequent two years of the study, a fixed nitrogen rate of 69 kg/ha (identified as optimum) was applied across all plots with varying phosphorus levels of 0, 10, 20, 30, and 40 kg ha-1 to pinpoint the phosphorus critical value and requirement factor. Soil samples were collected from the composite surface layer at each site before planting and again 21 days post-planting. Results revealed that the highest maize grain yield, averaging 7108 kg/ha, was achieved with an application of 69 kg N/ha alongside 46 kg P2O5/ha. The combination of 69 kg N/ha with 69 kg P2O5/ha yielded the maximum net return of 209,806 Birr per hectare. The study concluded that the phosphorus critical level for maize production in these soils is 31 ppm, with a phosphorus requirement factor of 3.06. These values merit validation through further trials before recommending for broader application.

VL  - 13
IS  - 5
ER  -
Oromia Agricultural Research Institute, Adami Tulu Agricultural Research Center, Batu, Ethiopia
Oromia Agricultural Research Institute, Adami Tulu Agricultural Research Center, Batu, Ethiopia